Dashboard
It's important to know how your proposals are doing. Data like percentage of proposals accepted and potential sales revenue can be fundamental to growing your business. In true Nusii style we've done our best to keep the Dashboard as functional as possible.
Here's a brief overview of what the Dashboard can tell you.
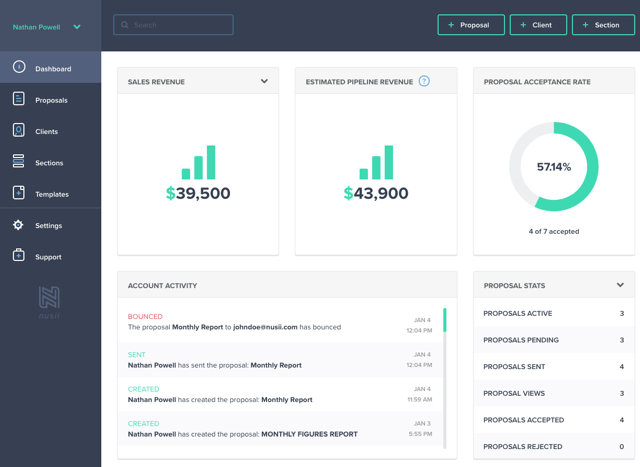
Sales Revenue
Keep track of your sales by:
- All time
- This month
- Last month
- Two months ago
- This year
- Last year
Estimated Pipeline Revenue
This is calculated using the best-case scenario of all your pending proposals. For example, if you have a proposal containing a fixed price total and optional extras Nusii will automatically include the most expensive option. Recurring sales cannot be included as the totals are unknown.
Proposal Acceptance Rate
It's vital to see how you or your sales team are doing. Are your proposals improving over time? Are you hitting those goals? Keep track here.
Account Activity
This is where you'll see everything that is happening in your account. It serves as a detailed overview of all proposals created, sent, accepted, rejected etc.
Proposal Stats
See at a glance how many proposals you have pending, sent, accepted and so on. This can be adjusted to view by:
- All time
- This month
- Last month
- Two months ago
If you have any questions, just ping us below. We'll be happy to help!